Crucially CySecTool is equipped with an optimization engine calculating the optimal portfolio for that attack scenario.
The user can define any attack scenario he desires; define both possible mitigations and attack steps
and for both provide numbers like probability of success, costs of mitigations etc..
Optimality of a portfolio is within budget constraints.
The budget sliders in the tool are (user defined) abstractions of real budgets. There are two kind of costs considered in the calculations:
- Direct costs are the monetary costs of implementing a control at the specified level (e.g. the cost of a software package, the time needed by system administrators to implement that control etc.)
- Indirect costs are the costs (in terms of productivity loss or similar) of implementing a control at the specified level, e.g. implementing a very aggressive password policy (like change passwords each month) may have significant indirect costs, for example time wasted in resetting passwords, call help center etc.
The theory and mathematics behind this tool are explained in this paper.
Short tutorial
To clarify the basics of our setup, let us consider the following toy scenario:
for the json source for this model click here .
The user can upload this model on the tool using "load model" button.
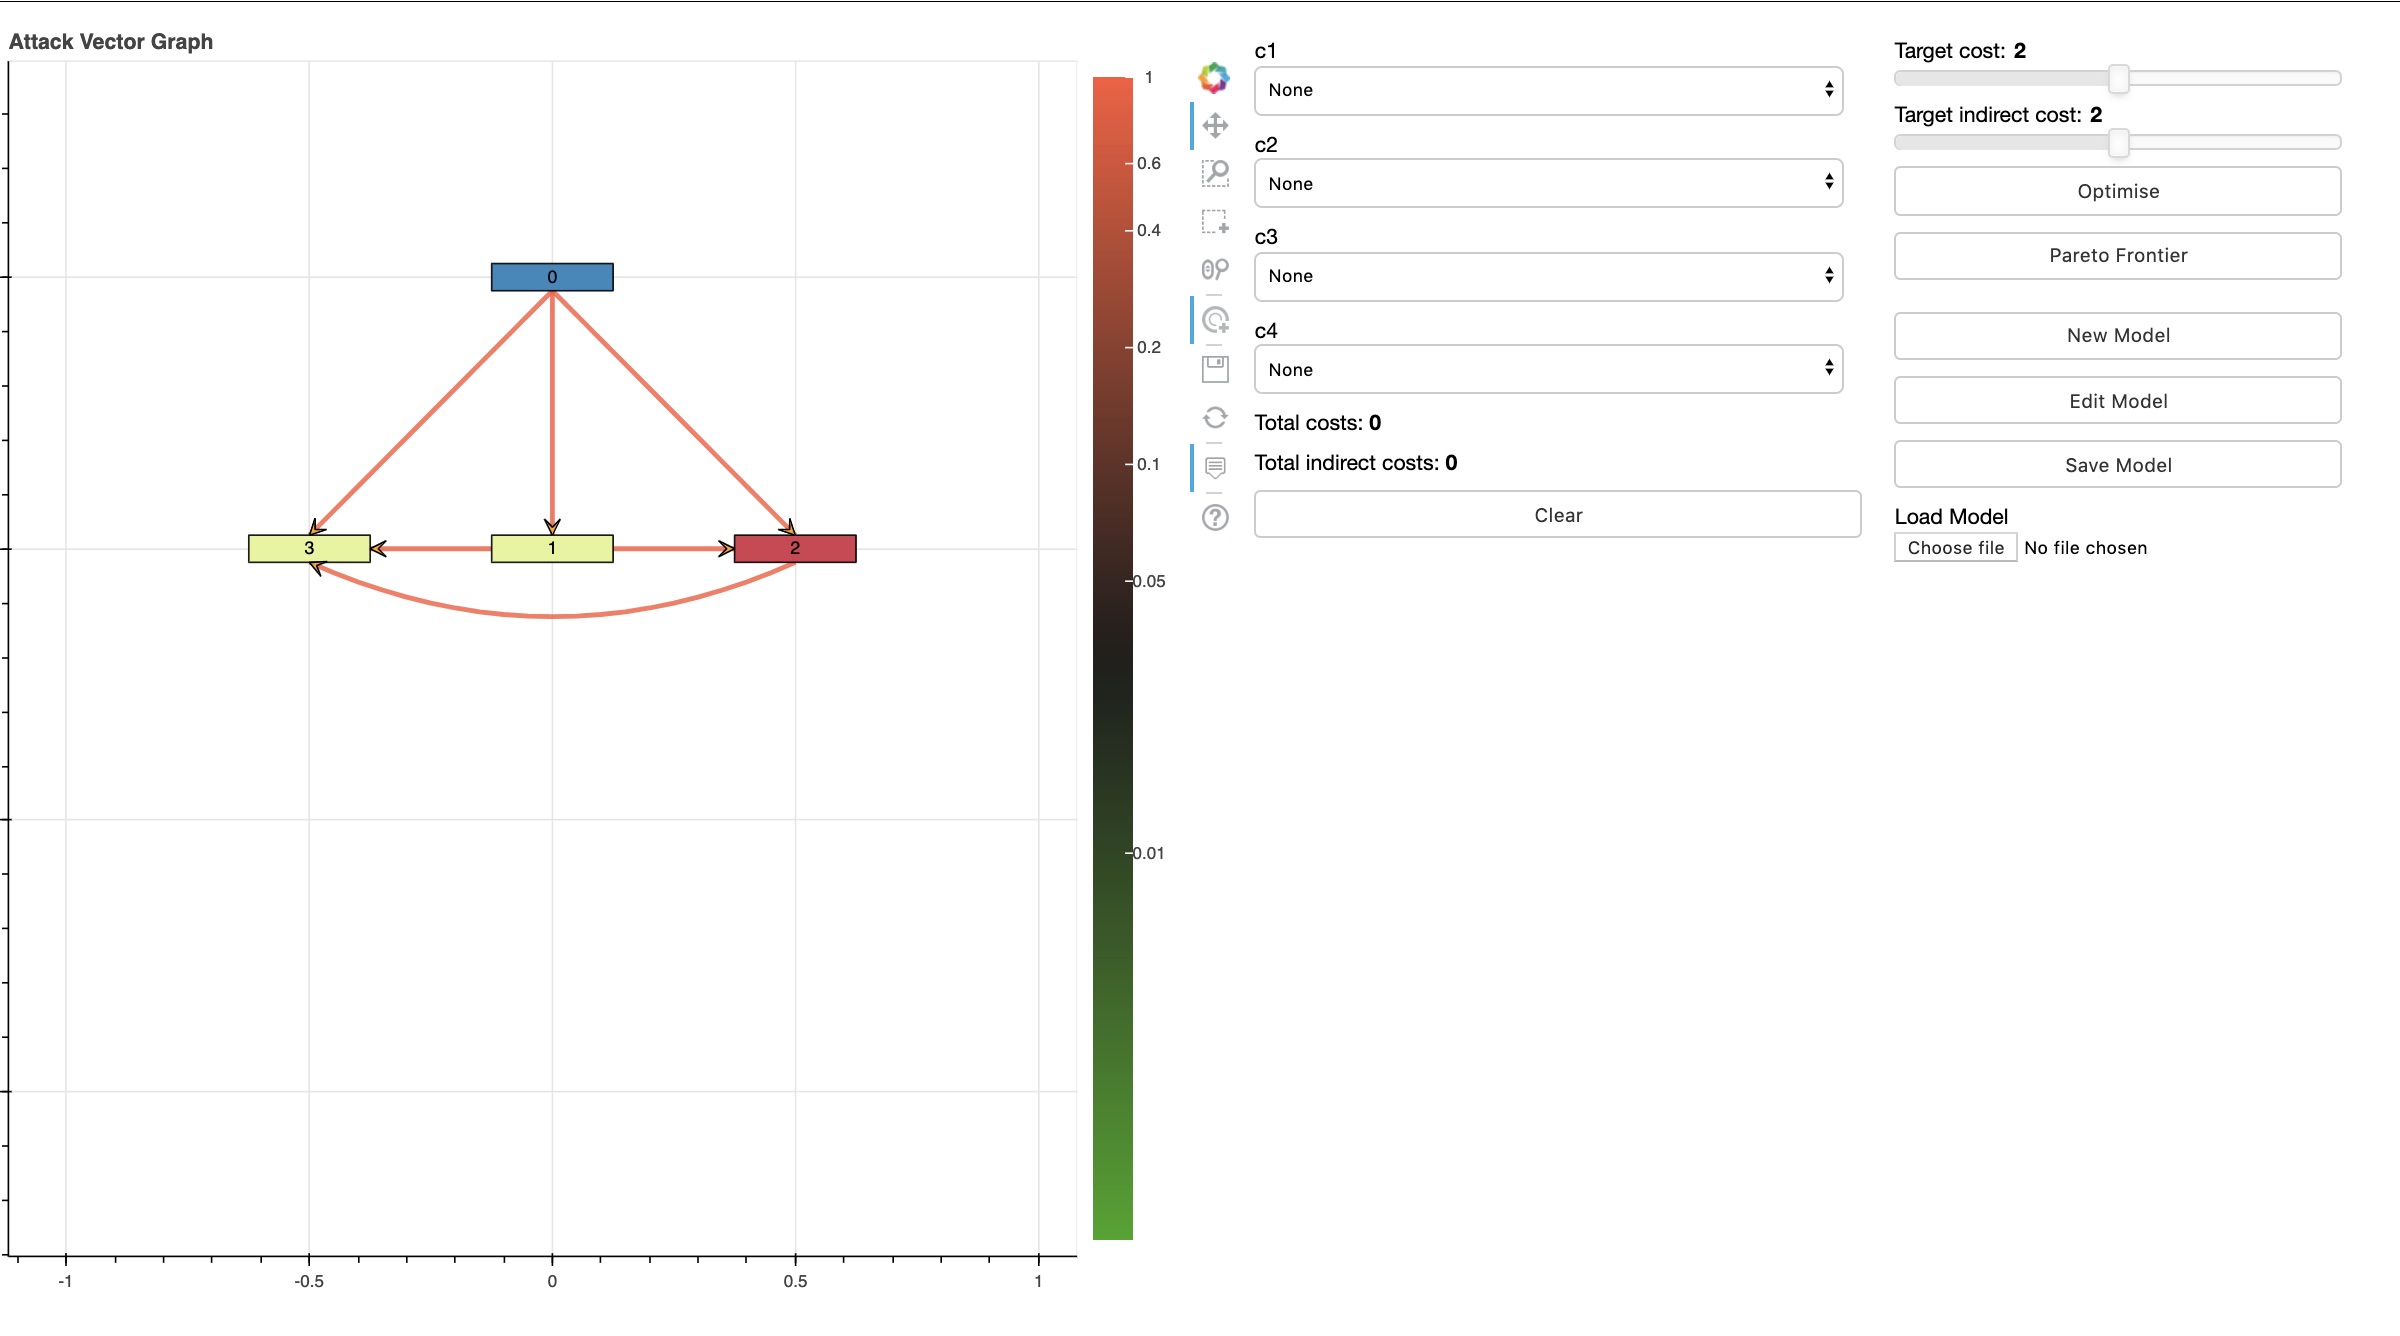
The screenshot shows three areas of the tool:
- on the left the visualization of the graph
- at the center the "Security Controls pane", i.e. all available controls are shown and can be selected (no controls are here selected). Below costs of selected portfolio of controls
- on the right the "Available user functions pane", e.g. select budgets. Upload, create, edit, save model. Optimize and calculate pareto frontier; The result of the optimization will be displayed on the controls pane and their effect visualized in the attack graph display
If the user clicks "optimize" the controls c2,c3 will be shown as selected in the controls pane to the right of the graph, also the colors on the graph change to visualize the mitigation (reduction of the attacker probability of success) induced by selecting c2,c3.
Mathematically this is a bi-level optimization problem: the defender wants to minimize the attacker's maximal probability of reaching the target. The minimization is the outer problem and the maximization is the inner problem.
The user can satisfy her/him-self that this choice is optimal (within those budgets) by trying any other combination of controls within budget and noticing that it will not return a lower probability on the edge to the target.
modelling attack scenarios
The user can create a model from scratch by clicking on "new model" or can edit an existing model (models are written in json format and all model data is editable). A model is defined by a graph, i.e. a set of vertices and edges, and a set of controls, for example for the toy model above the data (visible/editable clicking on the edit button) is seen in the screenshots below
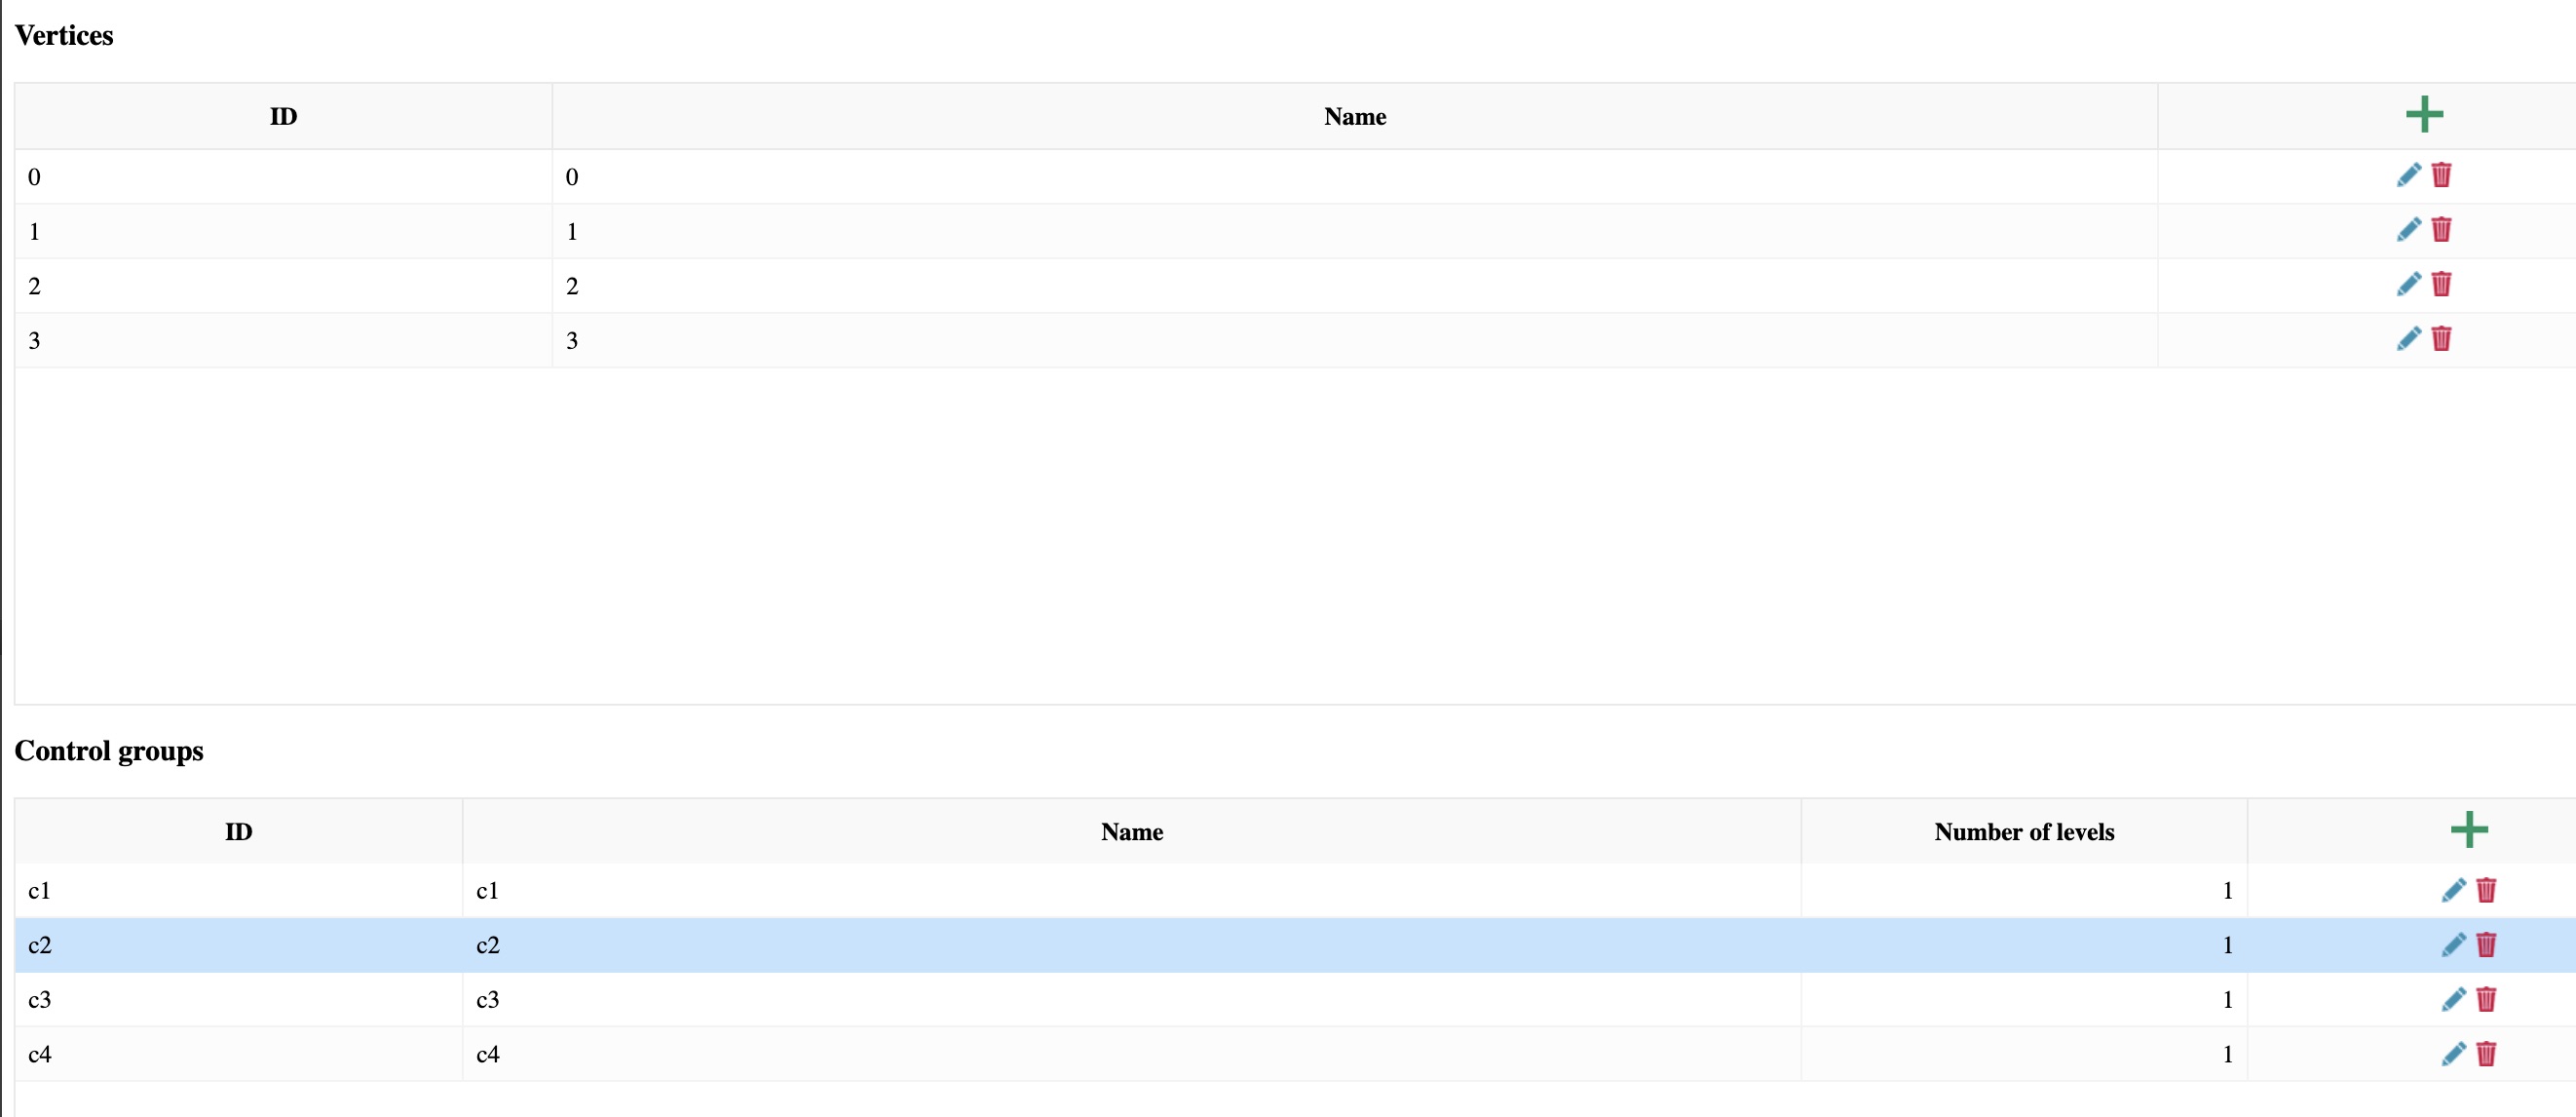
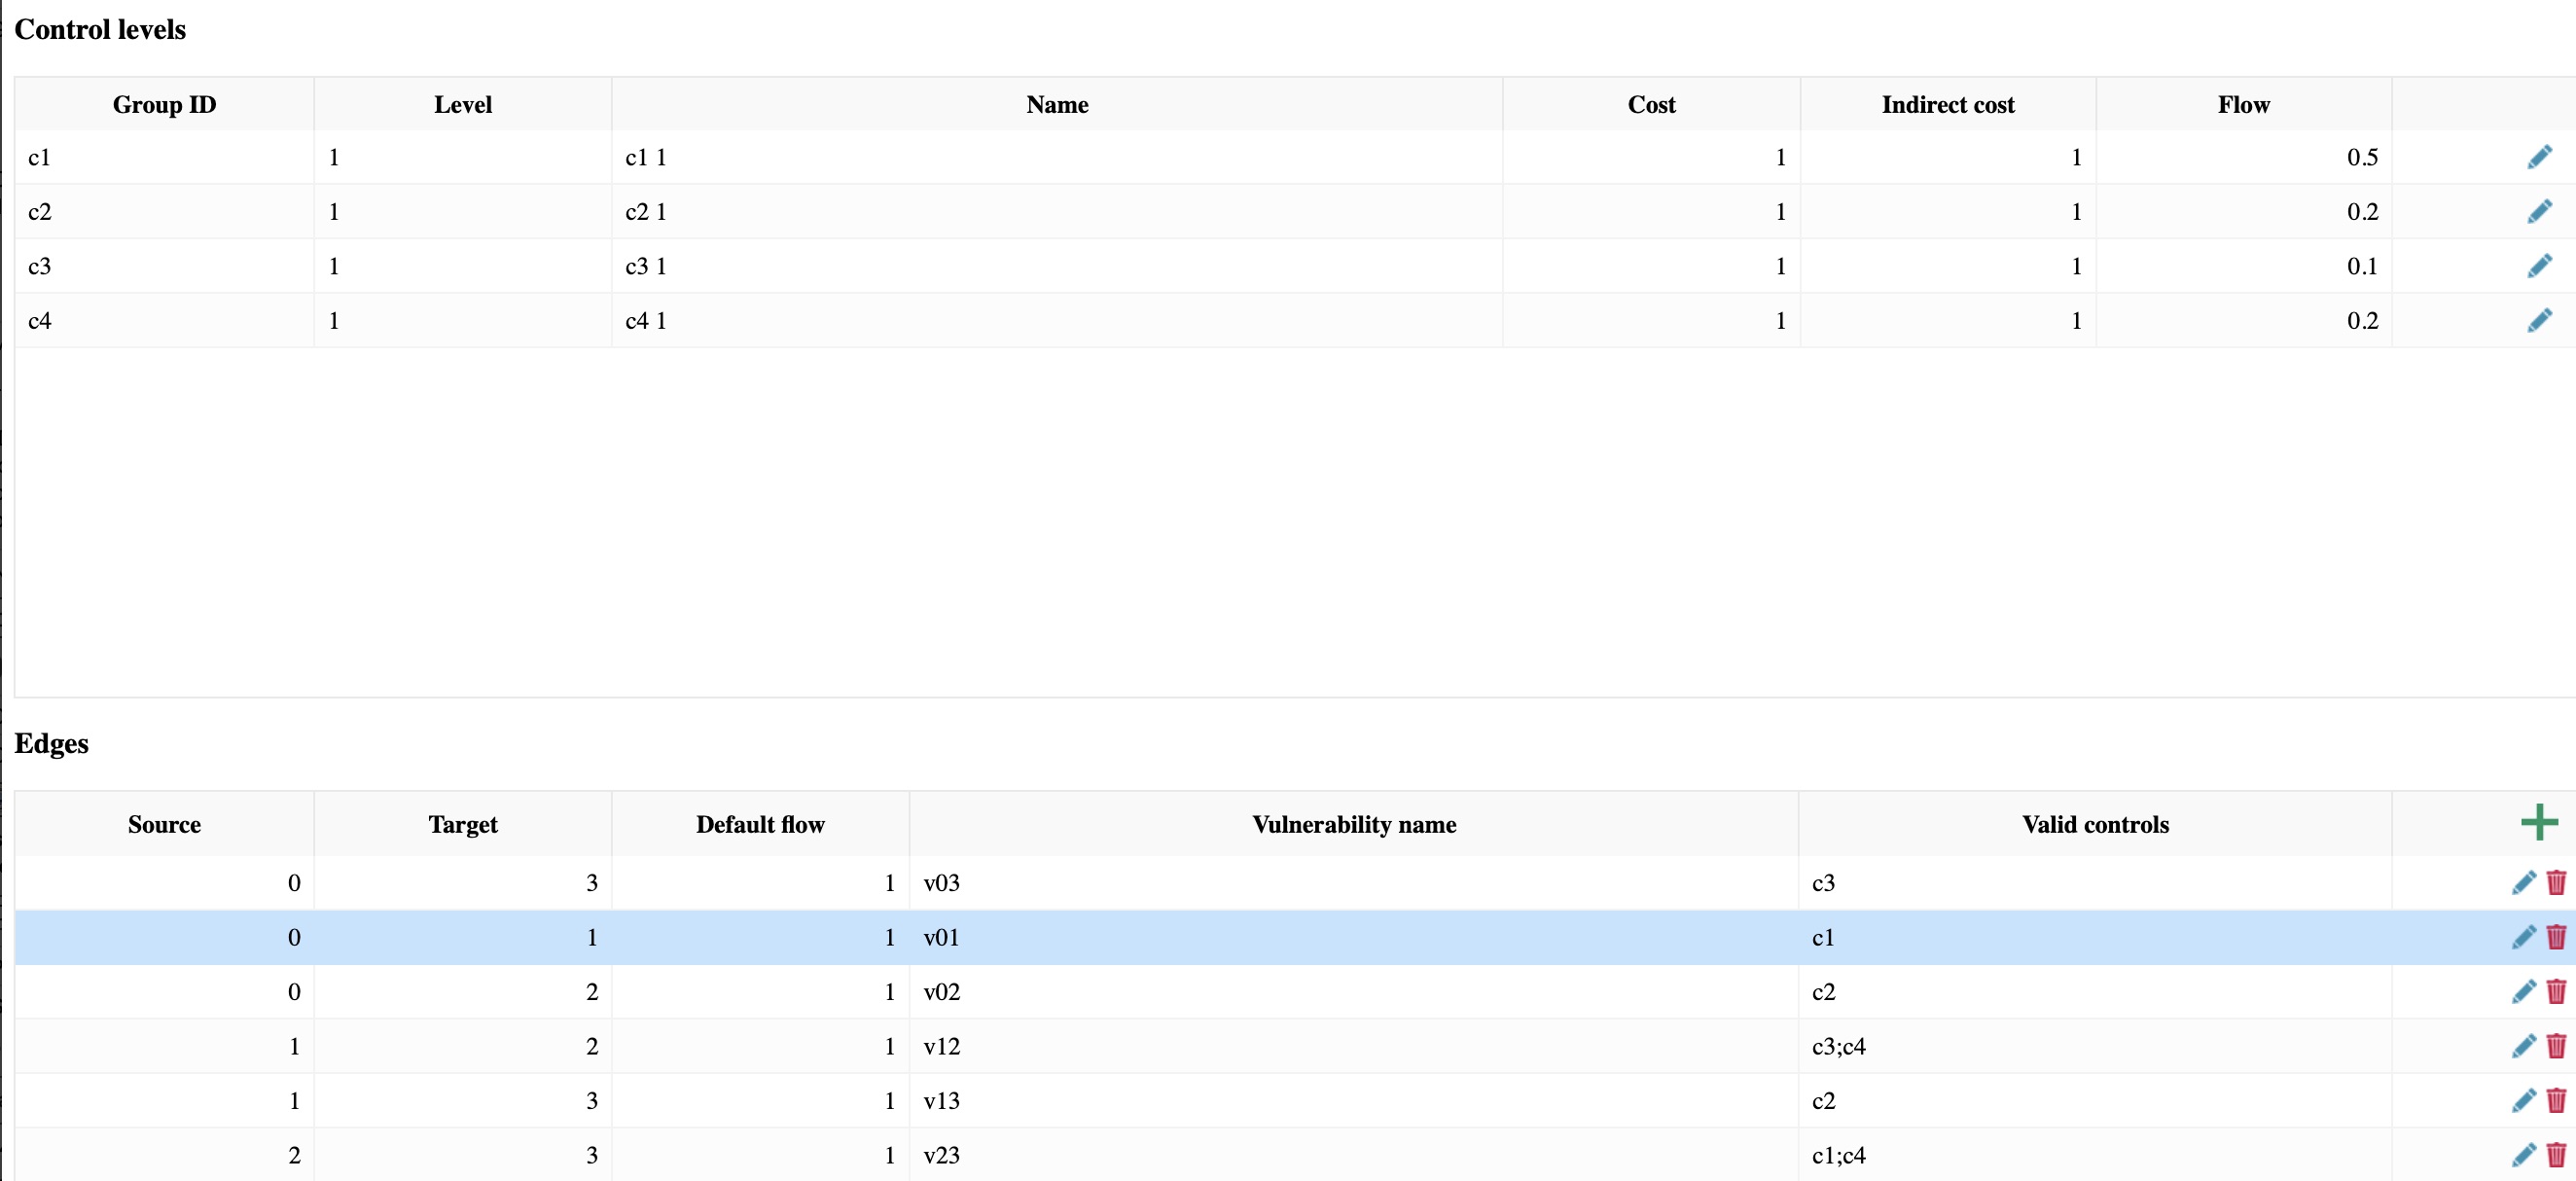
Each control is specified by a name, by the number of levels it can be implemented, by its direct and indirect costs and by its its flow (i.e. its effectiveness is deployed), e.g. a flow of 0.2 it means that if deployed that control would reduce the attacker probability on the edges the control is deployed by 0.2. Each edge has associated a list of controls, i.e. the controls that can mitigate that attack step.
The optimization engine is activated by clicking "optimize"; this will return the optimal portfolio for that choice of budgets and controls.
The optimal portfolio is shown in the controls pane and the probabilities induced by that portfolio on each edge are visualised using colors
in the graph pane;
the lower the probability of success of the attacker on an edge in a path
given the chosen portfolio the greener the edge color.
Another option is to compute the "Pareto frontier": this will display optimal solutions within budget constraints:
Each point along the Pareto frontier is a portfolio that is optimal
within budget and in relation to the indirect costs and security it induces.
When hovering over a point in the Pareto frontier graph you will see information like the cost of that portfolio (Direct cost) and its indirect cost (Organisation burden). Clicking on that point will display details of that portfolio on the control panels and on the graph in the main page
The default case study
the tool default case study (opening page or uploading "default template") is the following:The attacker may try a direct CVE exploit, e.g. a ssh CVE, or may try a staged attack by first exploiting a CVE on the webserver, e.g. a CVE on apache and then enter the organization LAN for the second stage. From inside the LAN the attacker can try to get a user credentials by sniffing the traffic or through brute force. There are also multiple ways to obtain user credentials from the outside world, e.g. by phishing, by using a compromised external device e.g. a public machine with a key-logger or a malicious wi-fi, or by using a watering hole, that is, by infecting websites that the users are known to visit and tricking them to give their credentials. An attacker with a user credentials can then log in as a user on a machine.
An attacker can also bypass obtaining credentials, e.g. by exploiting a CVE exploit that allows remote privilege escalation from the web-server on the internal server, or if an internal machine is white-listed or has hard-coded credentials, or by social engineering attacks like ``whaling'' which is a highly customized and personalized form of phishing, or (after using watering hole attack) installing malware on the user's machine. Once in control as user of a machine, the attacker could attempt to escalate privileges to get admin control, which is the target in the attack graph.
To incorporate the unlikelihood of attacks corresponding to direct edges corresponding to exploiting a potential CVE in the ssh service and ``whaling'' attack, we apply default baseline probabilities of 0.5 and 0.2 on them, respectively. The default probabilities on all other edges were taken as default to be 1.
Associated with each attack step in the graph are possible mitigations or security controls. For example a CVE exploit has two possible mitigations ``Sc'': Secure configurations (patching, whitelisting), as well as ``N1'': external Network security (firewall).
Each security control may have several levels. In this case study, we define levels so that higher levels include mitigations at the lower level. For example ``Secure configuration'' has three possible levels of implementation: at level 1, it is implemented as ``keep software up to date''; at level 2 it is implemented as ``keep software up to date and patch software when security patches are released''; and level 3 also adds whitelisting (in fact we left some freedom for interpreting the highest levels, in this case for example some expert preferred thinking of blacklisting), i.e. only software on an approved list are allowed to run, besides keeping software up-to-date and installing patches upon release. As another example, for ``user education'' control, the lowest level is to provide basic training, e.g. via online resources like videos and MCQs; the next level is basic training plus simulated social engineering attacks, where e.g. phishing emails are sent to employees to see if they click on the links; and at the highest level disciplinary actions are announced for employees who fall for simulated attacks.
Note that the threat scenario represented by this attack graph is rather high level. For example, there are thousands of CVEs over different systems, also there are important mitigations not included like penetration testing, or data backup policy, etc.
Our aim here is not to be exhaustive but to provide a stylized attack graph over which we can compare our results with experts' advice.
CySecTool
For questions on CySecTool you can contact us: p.malacaria@qmul.ac.uk and arman.khouzani@qmul.ac.uk.
The graphical interface and visualization have been implemented by Przemyslaw Andrzej Buczkowski p.a.buczkowski@se18.qmul.ac.uk
This prototype tool has been developed within the EPSRC project "Customized and Adaptive approach for Optimal Cybersecurity Investment"
(an EPSRC project involving Imperial College and Queen Mary University of London).