Why are you more likely to die
in a car crash when the road conditions are good compared with
when they are bad?
The data for road fatalaties in both the US and Europe is very curious.
The month in which there are fewest fatalities is February followed by
January. In other words, there are fewest fatalities when the
weather is at its worst and when presumably the roads are at their most
dangerous. If you apply traditional statistical regression
techniques using this available data you will end up with a simple
model like THIS:
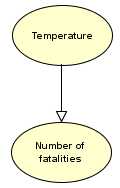
Colder months yield fewer fatalities. Now as a purely predictive model
you could argue that this is not too bad. But for risk management it is
useless, because it provides no explanatory power at all. In fact, from
a risk perspective this model would provide totally irrational
information since it would suggest that if you want to minimise your
probability of dying in a car crash you should do your driving when the
roads are at their most dangerous.
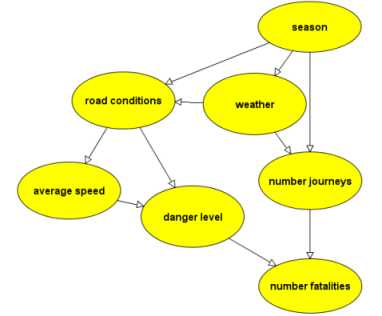
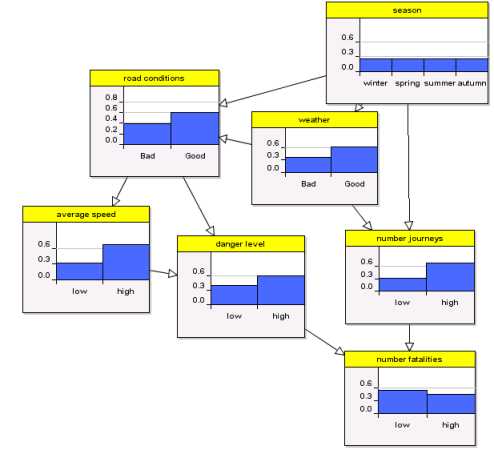
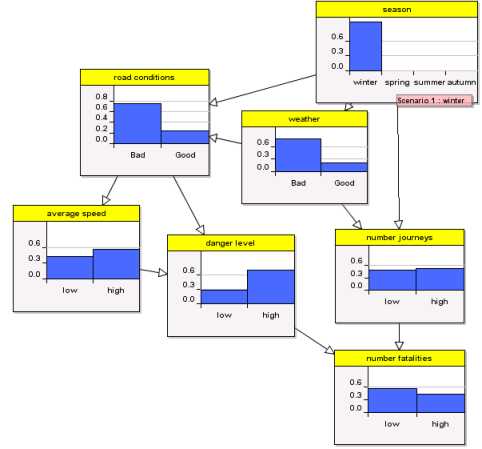
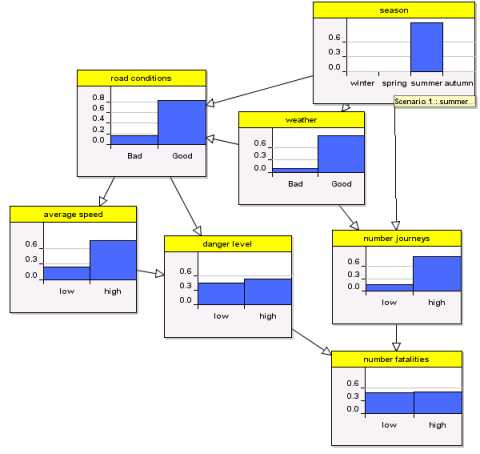
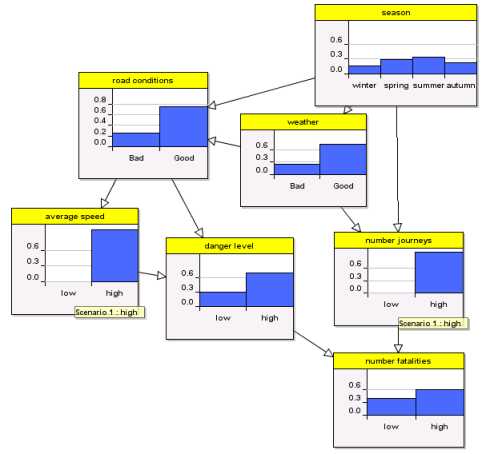
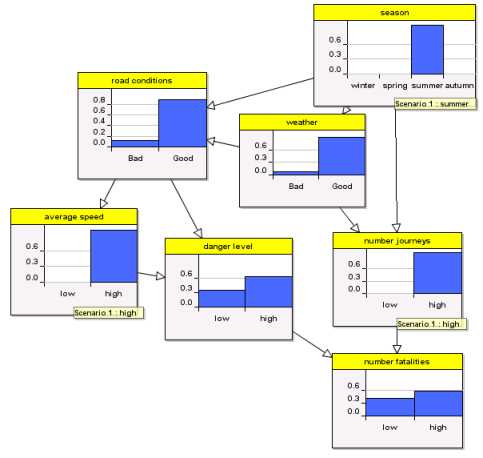
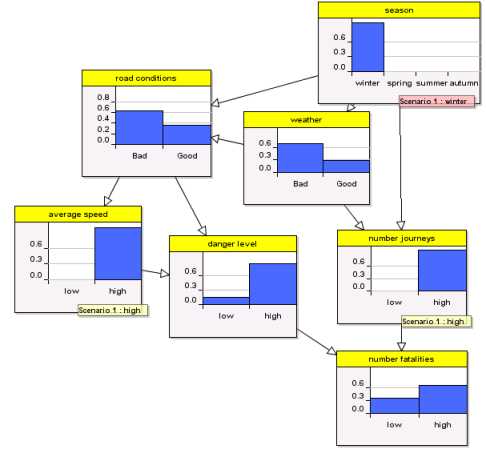
What we know is that there are a number of causal factors which do much
to explain the apparently strange statistical observations.
Clearly the season influences
whether the weather is good or not, and both this and the season
influence whether road
conditions are good.
When the road conditions are bad
people tend to drive
slower.
The danger level is at
its highest when people are driving fast and the road conditions are
bad.
Both the season and the weather
influence the number of
journeys made - people generally make more journeys in
summer and will generally drive less when wearther conditions are bad.
The actual
number of fatalities is influenced not just by the danger level but by
the number of journeys. If relatively few people are driving, albeit
dangerously, there will be relatively few fatalities.
Using this kind of model, which happens to be an example of Bayesian
Network, we can not just fully explain the statistical
observations but also use it to make sensible decisions about risk.
Notice that with each variable are the probabilities.
At this point we haven't entered any observations in the model, so what
we have above are called the prior probabilities. For example, the
prior probability that the weather is good is 63% and all the seasons
have equal probabilities. The prior probability of high number of fatal
accidents is 46%.
Now let’s enter some observations. Let’s first see
what happens in winter.
Notice how all the probabilities change. In winter road conditions are
more likely to be bad, but this means that people tend to drive slower.
Also fewer journeys are made in winter. The impact of this is that the
probability of high number of fatal accidents has dropped to 43%.
Now compare what happens in summer.
Road conditions are better but this means people drive faster. There
are also more journeys. These factors explain why we now see an
increase in the probability of high fatalities to 50%. This explains the
strange statistical results but doesn't help us with risk
reduction.
The only things we directly control ourselves are the speed we drive
and the number of journeys we make. Let’s suppose that,
irrespective of the time of year, we all drive fast and make
a lot of journeys:
Notice how the probability of
fatalities increases again to 61%. However, now compare the
situation between summer and winter. In summer the road
conditions are less likely to be bad so we see a drop to 59% in high
fatalitiy prob. In winter
road conditions are worse and the probability increases to
65%.
Driving fast and
often (Summer)
Driving fast and often
Winter
This tells us that if we do not alter our driving habits then
fatalities are more likely in winter than summer - exactly the
opposite of what the naïve model was telling us.