Distribution of Chosen Lottery Numbers
In this example
we saw that, in the first 1172 weeks of the lottery the number 38 was
chosen 175 times whereas the number 41 was chosen only 115 times.
Is there something special about these numbers?
In fact the apparently strange distribution for the number of times each number is chosen is entirely predictable, as we can now show (you can see this in action by running this model in AgenaRisk).
Each of the 49 numbers is equally
likely to be selected. Since six numbers are chosen each week, for each
number there is a 6/49 probability that it will be chosen. For any
number of weeks the number of times a given number will be chosen is a
binomial distribution where the number of 'trials' is simply the number
of weeks and the 'probability of success' is 6/49. If we run this
binomial distribution in AgenaRisk and enter the number of trials as
1172 we get the following distribution for the number of times a given
number will be chosen:
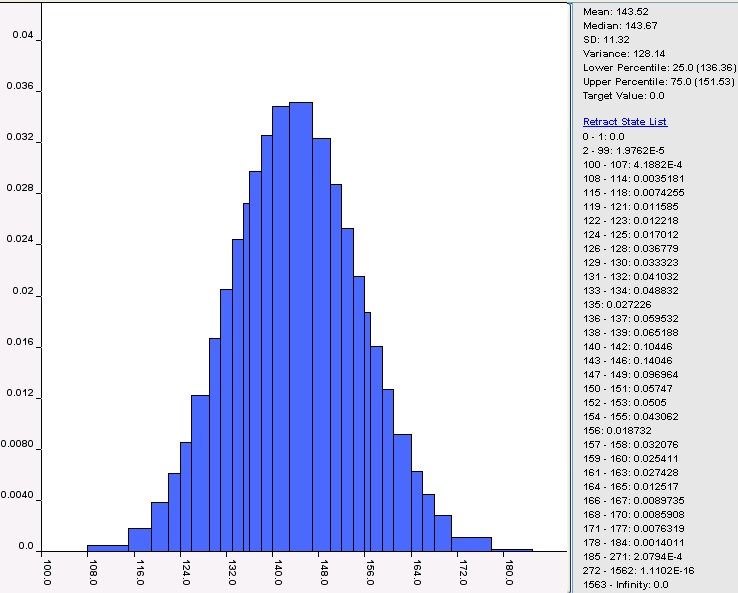
For example, looking at the
percentile information shown you can see that there is a 0.5
probability that the number of times the number will be chosen is
outside the range 136-152. In other words, since there are 49 numbers
we can actually expect about half of these (24) to be chosen either
less than 136 times or more than 152 times. That indeed is roughly what
happened in the real sample. Similarly, the probability that the number
will be chosen more than 171 times is about 0.012. Since there are 49
numbers, the probability that at least one of them is chosen more than
171 times is quite high (about 0.45). Hence the fact that one number
was chosen 175 times is not unusual.
Return to league tables example
Return to Main Page Making Sense of Probability: Fallacies, Myths and Puzzles
Norman Fenton