


Notes:
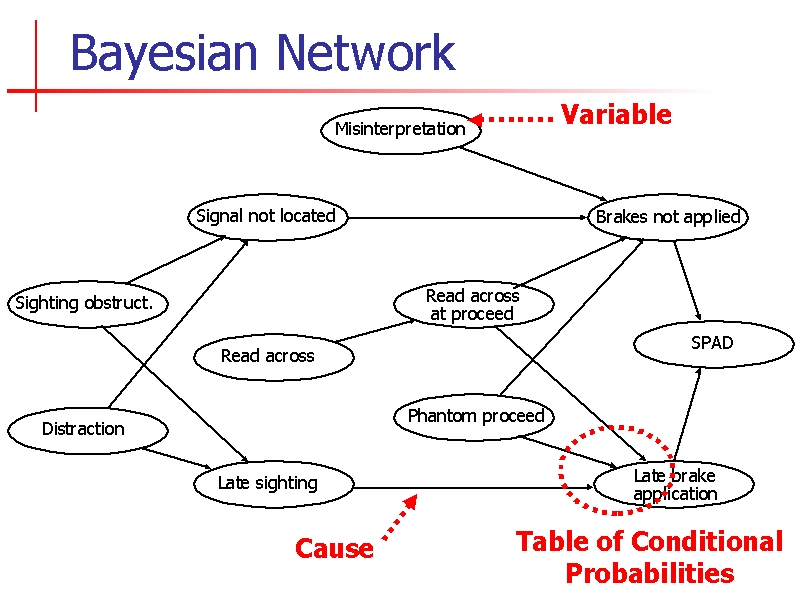
This slide shows a bayesian network. To introduce BNs I will explain what the nodes and arcs mean – I won’t explain the significance of this network on this slide.
The nodes are variables. Each variable has a set of possible states – for example the ‘read across’ variable represents whether or not a read across will occur on approach to a signal. Either it will or it won’t but we don’t know which, so we want to give each state a probability.
The arcs represent causes (or influences). For example if the driver seems a signal late he is more likely to apply the brakes late.
Of course, this is not certain. We need to represent the strength of each cause – how much late sighting increases the probability of late brake application. For this, there is a table of conditional probabilities for each arc.
A BN actually represents the the joint probability distribution of all the variables. When we know the state of some variables we can update the probabilities of the states of unknown variables. This is done using a standard theorem of probability due to Thomas Bayes 200 years ago – hence the name. Although the mathematics is simple, efficient computation with large Bayesian nets became practical only about 10 years ago.