Color Filter Arrays: Representation, Analysis and A Design Methodology
We have developed a novel mathematical representation of Colour Filter Arrays, the frequency structure, which makes analysis of all the CFAs easy, simple and visual, and based on that, a design methodology is developed for new CFAs. The comparison between the tentatively designed new CFAs and the Bayer CFA is exciting. The detailed results are listed below.
Color PSNR of the images demosaicked with 4 methods applied to Bayer CFA pattern and the new patterns
|
Bayer |
CFA4a |
CFA4b |
CFA6 |
CFA23 |
||||||
|
Image |
Homo |
POCS |
Naive |
Adapt |
Naive |
Adapt |
Naive |
Adapt |
Naive |
Naive |
|
1 |
35.13 |
37.82 |
35.55 |
38.14 |
39.48 |
39.65 |
40.31 |
40.39 |
40.16 |
40.82 |
|
2 |
39.10 |
39.58 |
39.20 |
39.82 |
39.85 |
39.92 |
41.46 |
41.41 |
41.57 |
40.53 |
|
3 |
41.21 |
41.66 |
40.99 |
41.28 |
41.31 |
41.64 |
40.94 |
41.13 |
41.12 |
41.32 |
|
4 |
39.00 |
40.07 |
40.59 |
40.68 |
40.15 |
40.24 |
41.80 |
41.88 |
41.57 |
40.19 |
|
5 |
35.42 |
37.57 |
37.08 |
37.68 |
37.17 |
37.82 |
37.09 |
37.47 |
36.82 |
37.19 |
|
6 |
37.61 |
38.65 |
36.94 |
39.95 |
40.16 |
40.82 |
40.63 |
41.06 |
40.78 |
41.03 |
|
7 |
40.51 |
41.74 |
41.72 |
42.09 |
41.94 |
42.16 |
41.49 |
41.64 |
41.57 |
41.47 |
|
8 |
33.77 |
35.35 |
31.85 |
35.13 |
37.25 |
37.56 |
37.76 |
37.97 |
36.78 |
37.65 |
|
9 |
40.93 |
41.91 |
40.51 |
42.02 |
42.31 |
42.48 |
41.70 |
41.85 |
41.56 |
42.23 |
|
10 |
40.58 |
42.07 |
41.49 |
42.12 |
41.96 |
42.56 |
42.18 |
42.56 |
42.23 |
42.66 |
|
11 |
37.53 |
39.29 |
38.07 |
39.74 |
39.87 |
40.19 |
40.78 |
41.01 |
40.41 |
40.09 |
|
12 |
41.68 |
42.68 |
41.11 |
43.10 |
43.55 |
43.81 |
43.81 |
43.94 |
43.55 |
43.84 |
|
13 |
31.36 |
34.42 |
34.06 |
34.93 |
34.61 |
34.97 |
34.88 |
35.10 |
35.11 |
35.16 |
|
14 |
35.29 |
35.91 |
35.31 |
35.55 |
35.54 |
35.64 |
35.73 |
35.80 |
35.87 |
34.97 |
|
15 |
37.84 |
39.35 |
39.41 |
39.45 |
39.15 |
39.45 |
40.24 |
40.44 |
40.06 |
39.22 |
|
16 |
41.47 |
41.87 |
39.74 |
43.78 |
43.80 |
44.35 |
44.10 |
44.42 |
44.47 |
44.48 |
|
17 |
39.23 |
41.49 |
40.93 |
41.32 |
41.27 |
41.62 |
41.26 |
41.50 |
40.97 |
41.05 |
|
18 |
34.47 |
37.24 |
36.78 |
37.01 |
36.75 |
36.98 |
36.82 |
36.96 |
37.06 |
36.80 |
|
19 |
38.35 |
39.90 |
36.49 |
40.27 |
41.16 |
41.32 |
41.32 |
41.41 |
40.60 |
41.26 |
|
20 |
39.03 |
40.69 |
39.75 |
40.15 |
40.88 |
41.18 |
40.74 |
40.93 |
40.28 |
41.12 |
|
21 |
36.56 |
38.97 |
37.47 |
38.70 |
39.82 |
40.08 |
40.07 |
40.21 |
40.22 |
39.85 |
|
22 |
36.35 |
37.90 |
36.98 |
37.76 |
38.27 |
38.30 |
38.29 |
38.31 |
38.23 |
38.24 |
|
23 |
41.69 |
41.92 |
41.83 |
41.99 |
42.10 |
42.20 |
42.19 |
42.22 |
42.28 |
41.85 |
|
24 |
32.97 |
34.67 |
34.32 |
34.66 |
35.03 |
35.34 |
35.28 |
35.42 |
35.37 |
35.38 |
|
Average |
37.80 |
39.28 |
38.26 |
39.47 |
39.72 |
40.01 |
40.04 |
40.21 |
39.94 |
39.93 |
The test images:
Kodak Lossless True Color Image Suite, http://r0k.us/graphics/kodak/
The demosaicking methods:
[Homo] K. Hirakawa and T. W. Parks. "Adaptive homogeneity-directed demosaicing algorithm", IEEE Trans. Image Process, Vol. 14, no. 3, pp. 360-369, 2005.
[POCS] B.K. Gunturk, Y. Altunbasak, and R.M. Mersereau. "Color plane interpolation using alternating projections", IEEE Trans. Image Processing, Vol. 11, no. 9, pp. 997-1013, 2002.
[Naive] Simply average the filtered chroma components at different frequency points.
[Adapt] E. Dubois. "Frequency-domain methods for demosaicking of Bayersampled color images", IEEE Signal Processing Letters, Vol. 12, no. 12, pp. 847-850, 2005. (http://www.site.uottawa.ca/~edubois/demosaicking/)
- and - D. Alleysson, S. Susstrunk, and J. Herault. "Linear demosaicing inspired by the human visual system". IEEE Trans. Image Processing, Vol. 14, no. 4, pp. 439-449, 2005.
The CFA patterns:
[Bayer] B.E. Bayer. "Color imaging array". U.S. Patent 3 971 065, 1976.
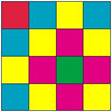
[CFA4a] a newly designed CFA pattern of size 4x4
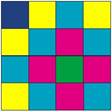
[CFA4b] another newly designed CFA pattern of size 4x4
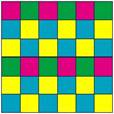
[CFA6] a newly designed CFA pattern of size 6x6
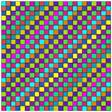
[CFA23] a newly designed CFA pattern of size 23x23
|
|
|
|
|
|
CFA4a |
CFA4b |
CFA6 |
CFA23 |
All the demosaicked images can be downloaded here: http://www.dcs.qmul.ac.uk/~phao/CFA/images/
The publications:
* Jue Wang,
Chao Zhang, and Pengwei Hao, "New Color Filter
Arrays of High Light Sensitivity and High Demosaicking Performance",
the IEEE International Conference on
Image Processing (ICIP), Brussels, Belgium, Sept 11-14, 2011. (slides)
* Pengwei Hao, Yan Li, Zhouchen Lin, and Eric Dubois, "A Geometric Method for Optimal Design of Color Filter Arrays", IEEE Transactions on Image Processing, Vol. 20, No. 3, pp. 709-722, March 2011.
* Yan Li, Pengwei Hao, and Zhouchen Lin, "The Frequency Structure Matrix: A Representation of Color Filter Arrays", International Journal of Imaging Systems and Technology, Vol. 21, No. 1, pp. 101-106, 2011.
* Yan Li, Pengwei Hao and Zhouchen Lin, "Color Filter Arrays: Representation and Analysis", Research Report, Dept of Computer Science, Queen Mary, University of London, RR-08-04, ISSN 1470-5559, May 2008.
* Yan Li, Pengwei Hao and Zhouchen Lin, "Color Filter Arrays: A Design Methodology", Research Report, Dept of Computer Science, Queen Mary, University of London, RR-08-03, ISSN 1470-5559, May 2008.
The MATLAB code:
The code is provided for generation of the frequency structure, the multiplexing matrix and the demosaicking matrix for analysis of a given CFA pattern with thresholding to remove the numerical error (readme, zipped file of the all).
Contact:
Dr Pengwei Hao
Department of Computer Science
Queen Mary, University of London
Mile End Road
London, E1 4NS
United Kingdom
Tel. 0044-20-7882-5207
Fax: 0044-20-8980-6533
e-mail: phao@eecs.qmul.ac.uk