Imagine an urn contains a large number of blue and white balls. If you know that 30% of the balls are white, then there is a standard method – the Binomial distribution – for calculating the probability of selecting, say, exactly 2 white balls out of a sample of 5.
The Binomial distribution tells you that:

More generally the distribution tells
you that

where p is the proportion of white balls (which you can think of as the probability of a randomly selected ball being white)
What we have done here is to calculate the probability of seeing certain data given a known value for p. But in many situations, the problem is that we do not know the value of p. What we want to do instead is to infer the value of p from the data we have observed. Suppose, for example, we have selected 2 white balls out of a sample of size 5. The question we ask is: given the data (i.e. the observation of 2 white balls from 5) what is the most likely value of p? This is a classic problem for all kinds of researchers ranging from opinion pollsters through to clinicians. They want to find out the (unknown) proportion of people who support a candidate Joe Bloggs (or who have a particular disease). Because they cannot ask every person, they instead sample of a few hundred.
Now, if we have observed 2 white balls in a sample of size 5, then we can use the Binomial distribution formula to ask the question: what is the most likely value of p that would give rise to finding 2 white balls in a sample of 5. In other words, out of all possible values of p, which one makes the following function of p the greatest?

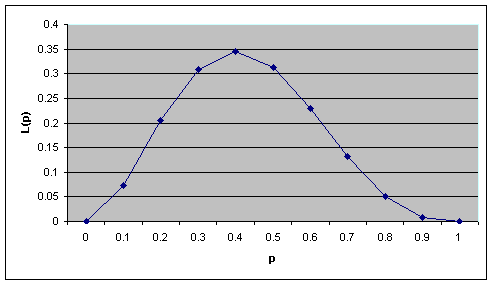
This function of p is called the Likelihood of p (often written as L(p)) and we can simply plot a graph showing the result of the function for all values of p between 0 and 1 as shown in FIG.

What is clear from the figure is that the maximum value occurs when p = 0.4, which happens to be the same as the sample proportion. This is not a coincidence.
In general, if we observe x white balls in a sample of size n the likelihood function of the unknown parameter p is:

Our task is to find the value of p for which the function L(p) is greatest. For those of you who remember your school calculus, this is actually quite easy. As long as the function has some nice properties (which we will not go into here) the maximum is the value for which the differential is equal to zero. In other words we just differentiate the function L(p) with respect to p, set L(p) to zero and solve the resulting equation for p.
Noting that the expression

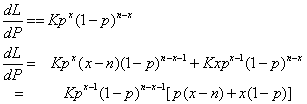
in L(p) is simply a constant, which we can write as K, the differential of L(p) (written dL/dP) is:

So when dL/dP is set to 0 we get:
0 = p(x-n) + x(1-p)
= x - pn
so p=x/n which is the sample mean.
Although we have concentrated on a special case, we have illustrated the key principles of maximum likelihood estimation.