Backwards reasoning fallacy
Suppose it is known that, on average, 50% of the students who start a course pass it. Is it correct to conclude the following?:
a) A courses that starts with 100 students will end up, on average, with 50 passes
b) A course that ends with 50 passes will, on average have started with 100 students
In fact a) is normally correct but b) is normally not. This has everything to do with the way we reason with prior assumptions (this reasoning lies at the heart of the Bayesian approach to probability).
To understand this fallacy we have to
work with an example. The crucial prior assumption in this case is
the ‘distribution’ of student numbers who start
courses. Let’s suppose that these are courses in a particular
college where the ‘average’ number of students per course
is 180. We know that some courses will have more than 180 and some
less; suppose the distribution of student numbers looks like this:
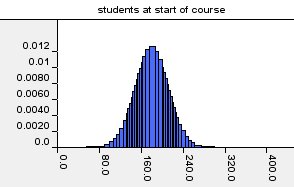
This is a bell curve (a 'Normal distribution') whose average (mean) is 180.
Distributions like this are
characterised not just by the mean, but also by the variance, which is how ‘spread out’ the
distribution is. The lower the variance the closer most of the data are
to the mean. In this example the variance is 1000 which means that
about 95% of the data lie within plus or minus 60 of the mean (that is
‘two standard deviations’ where the standard deviation is
the square root of the variance).
Because the number of students who pass is influenced by the number who start, we represent this relationship as follows:
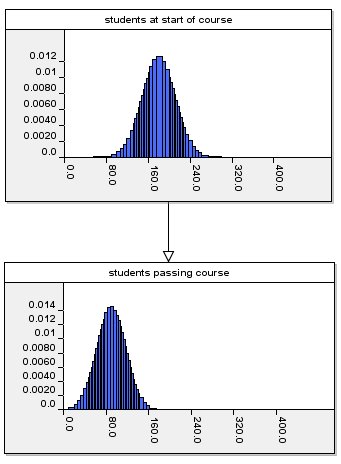
As in any model like this (it is a
Bayesian net or risk map) we need to define not only the
distribution for the node representing students starting course
(which we have said is a Normal distribution with mean 180 and variance
1000) but also the distribution for the node representing students passing course. Since this latter number is dependent on the former what we actually need to define is the so-called conditional distribution.
We know that on average the number of students who pass is 0.5 times
the number who start. But this is a probabilistic relationship, not a
certain relationship. What we can reasonably say is that the mean of
the distribution of the number who pass is 0.5 times the number who
start. So, it seems reasonable again to use a Normal distribution whose
mean is 0.5 times the number who start. We assume that the
variance of this distribution is 500.
Thus, if we know that 100 students
start the course then the (predicted) distribution for the number who
will pass looks like this:
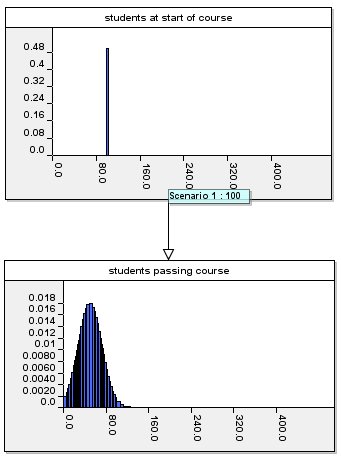
As you would expect the mean of the predicted distribution is about 50.
However, suppose we do not know the
number who start but we know that 50 passed a particular course. In
this case we use the model to reason backwards and it gives the
following result:
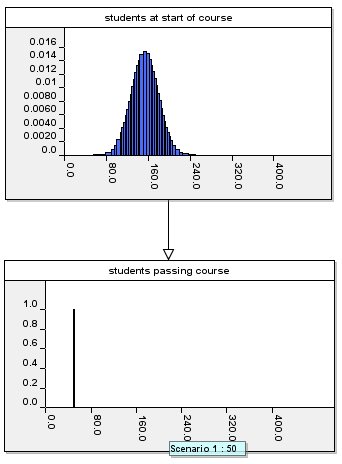
Curiously the mean of the predicted
distribution for the number who started this course is not 100 but is
much higher – it is about 153. This seems to be wrong. But in
fact, the fallacy is to assume that the mean should have been 100.
What is happening here is that the
model is reasoning about our uncertainty in such a way that our prior
assumptions are taken into consideration. Not only do we know that the
average number of people who start a course is 180, but we also know
that it is very unlikely that fewer than 120 people start a course
(there are some such courses but they are rare). On the other hand,
while on average a course with, say 150 starters will on average result
in 75 passes, about 5% of the time the number of passes will be 50 or
lower.
Hence, if we know that there is a very low number, 50, of passes on a course there are two possible ‘explanations’.
- there might have been far fewer students start the course than the 180 we expected
- the pass rate for the course might have been far lower than the 50% we expected.
What the model does is shift more of
the explanation on the latter than the former, so it says “I am
prepared to believe there were fewer students start this course than
expected but the stronger explanation for the low number of passes is
that the pass rate was lower than expected”.
This is the Bayesian approach to
reasoning. Is it rational? Instead of the prior distribution above
suppose that, give or take a handful of students, there were always 180
students starting a course. If you discover that only 50 students had
passed a course you would have to conclude that a much lower than
expected pass rate was to blame. In this extreme case your prior belief
about the number of starting students is very strong and cannot be
shifted by other observations.
If, however, you had no such strong beliefs about the number of
starting students then everything is different. For example, starting
with an ‘ignorant’ prior distribution (called the uniform distribution), and if we
discover 50 students passing a course, then the model does indeed
conclude that it is most likely to have started with about 100
students:
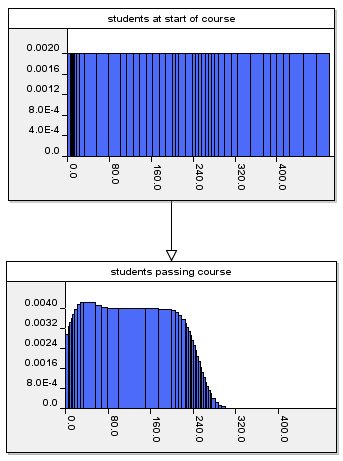
'Ignorant' Prior
|
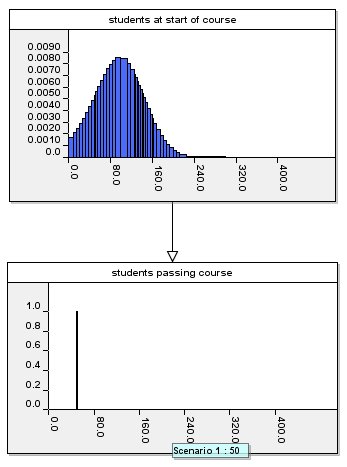
Backward reasoning with ignorant prior
|
This type of problem is extremely common.
For example, in a real-life project I was involved in we were tackling
the problem of attrition rates for classes of military vehicles in
combat.
On the one hand we needed to know the likely number of vehicles left
operational at the end of combat given certain combat scenarios. On the
other hand, given a requirement for a minimum number of vehicles to be
operational at the end of combat we needed to calculate the minimum
number of vehicles to start with.
Although the model involved many variables you can think of it in terms exactly like the above model where vehicles at start of combat replaces students starting course and operational vehicles at end of combat replaces students passing course.
As in the above example users of the model could not understand why it
predicted 50 vehicles at the end of combat given 100 vehicles at the
start, yet predicted over 150 vehicles at start given 50 at the end.
Since the prior distribution for
vehicles had been provided by the users themselves the model was
working correctly, even if it did not produce the results that they
felt were ‘sensible’. In this case it was the strength of
the prior distribution that the users had to review for correctness.
You can try out the model used above by running it using the AgenaRisk tool which you can download here. The model is here.
For further information about this kind of probability reasoning check this out.
Norman Fenton
Return to Main Page Making Sense of Probability: Fallacies, Myths and Puzzles


